
SOILS4MED goes beyond data collection: it demonstrates how harmonized soil data and information can drive better decisions for land and water management at multiple scales.
The project feeds newly produced soil and data information — combined with legacy soil datasets — into state-of-the-art Decision Support System (DSS) tools, demonstrating their capacity to support:
- Sustainable soil and water management (SSWM) at farm and landscape scale
- Land Degradation Neutrality (LDN) monitoring and reporting
- Precision farming — rational management of water, nutrients, and inputs
- Soil carbon stock and sequestration potential mapping, contributing to climate monitoring goals
- Enhanced soil condition and degradation mapping at the regional level.
These applications demonstrate the tangible societal and economic value of investing in quality soil data — translating scientific outputs into tools usable by farmers, advisors, policymakers, and international bodies alike.
Land Degradation Neutrality tool
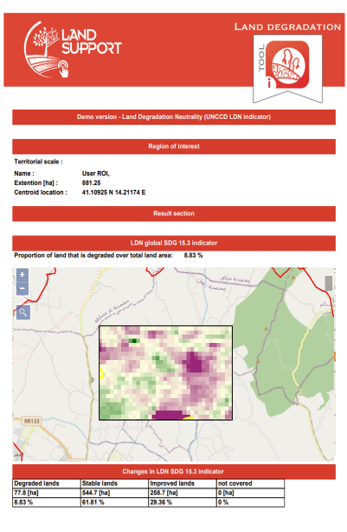
The Sustainable Development Goal (SDG) 15.3 target is to achieve a land degradation-neutral (LDN) world. According to the United Nations Convention to Combat Desertification (UNCCD) methodology, SDG indicator 15.3.1 assesses the proportion of land that is degraded through the integration of three sub-indicators: (i) land productivity, (ii) land cover change, and (iii) soil organic carbon, following the One-Out All-Out principle. Within SOILS4MED, the assessment builds on the official UNCCD framework but focuses specifically on the land productivity sub-indicator to estimate land degradation, drawing on previously published scientific studies that demonstrate the effectiveness of this approach. Land productivity is assessed by analysing temporal trends in annual maximum NDVI derived from Landsat imagery at 30 m spatial resolution and processed in Google Earth Engine. The workflow combines the Mann–Kendall test and Sen’s slope estimator with locally calibrated thresholds defined with the support of local experts and stakeholders, enabling a spatially detailed assessment of vegetation productivity trends and land degradation. The LDN tool was developed through close collaboration with ICARDA — International Center for Agricultural Research in the Dry Areas (Lebanon), DGACTA/MARHP — Direction Générale de l’Aménagement et de la Conservation des Terres Agricoles (Tunisia), Cukurova University (CU, Turkey), Zagazig University (ZU, Egypt), LARI — Lebanese Agricultural Research Institute (Lebanon), and the University of Jordan (JU, Jordan). It is currently available for the Sminja area in Zaghouan (Rmel watershed) in Tunisia, the Jarash and Ajloun areas in Jordan, and the whole of Turkey, where has been applied a mask to delimit five basins, namely Yozgat, upper Sakarya, Seyhan, Karapinar and Buyuk Menderes.
Pesticide Fate tool
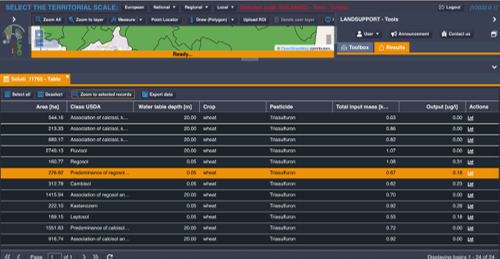
High concentrations of pesticides in groundwater are a major pollution risk, with potential long-term impacts on the environment and human health. It is therefore important to have tools that map the zones most vulnerable to specific pollutants and land uses. The Pesticide Fate tool (Bancheri et al., 2022) is a web-based, dynamic tool developed within the LANDSUPPORT geospatial decision support system to assess groundwater vulnerability to specific pesticides. It is based on the extended transfer function model, which simulates the transport of reactive solutes from the soil surface, through the unsaturated zone, down to the water table. The tool combines soil physical and hydrological properties, climate data, groundwater table depth, crop types and the related pesticide applications, including amounts and timing. The results are shown as maps of the relative pesticide concentration reaching the water table at the end of the simulation period, and as cumulative charts of solute arrival at the depth of interest. The tool was developed through close collaboration with ICARDA (International Center for Agricultural Research in the Dry Areas, Lebanon), DGACTA/MARHP (Direction Générale de l’Aménagement et de la Conservation des Terres Agricoles, Tunisia), Cukurova University (CU, Turkey), and Zagazig University (ZU, Egypt). It is currently available for the El Aroussa region in Tunisia, the Adana region in Turkey, and AbdelRahman Farm in Egypt.
GeOC
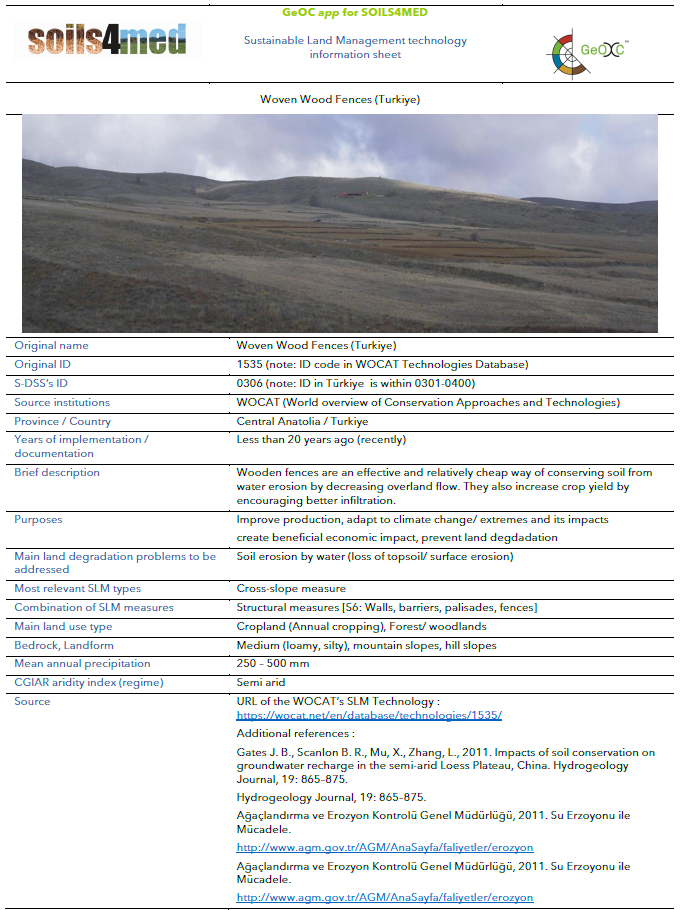
Sustainable Land Management (SLM) practices can best help achieving LDN if they fit the social and ecological contexts. GeOC (Geoinformatics Options by Context) is designed to provide land users, development projects, and policy decision-makers with plausible robust contextual similarity unit (CSUs) maps for (a) assisting the selection of SLM options fitting to contexts, and (b) using CSUs as extrapolation domains for context-relevant out-scaling of SLM (Le et al. 2016; Le et al. 2017). GeOC functions based on a CSU map and on sets of georeferenced and standardized SLM data. The CSU map is the result of a separate study that performed socio-ecological cluster analysis and tested differences in LDN indicators among clusters (Le et al. 2022). The CSU map shows the spatial pattern of CSUs that are clusters of biophysical, economic and social contextual factors/drivers of land use and land management, which influence SLM adoption and the resulting LDN scenarios.
The SLM data have been purposely compiled for LANSUPPORT project from different sources. Each SLM consists of one or more points representing the sites where these practices have been implemented. Each SLM is associated with a downloadable PDF fact sheet describing its characteristics.
The tool, developed by UNINA and ICARDA with the collaboration of UNISS, describes the area of interest, freely selected by the user (from the geographic areas of Egypt, Greece, Italy, Jordan, Lebanon, Morocco, Spain, Tunisia, and Turkey), in terms of CSUs and, based on this, recommends the corresponding SLMs.
Soil carbon modelling and mapping
Management scenarios across Mediterranean study areas and high-resolution projections for the Lower Seyhan Plain
SOILS4MED combines soil measurements, land-use information and monthly climate data to study soil organic carbon (SOC), calculate topsoil carbon stocks and explore changes in carbon inputs, crop residues and vegetation cover. The work presented here brings together datasets from Greece, Italy, Spain and Morocco with a spatially detailed application in the Lower Seyhan Plain, Adana, Türkiye.
These applications connect location-based scenario analyses with high-resolution soil carbon mapping. In the first, georeferenced results estimate SOC gain or loss and CO₂ released through organic matter decomposition. In the Lower Seyhan Plain, maps of current SOC stocks, projected stocks and carbon sequestration potential are key outputs of a Decision Support System (DSS). Both support comparison of defined management scenarios and identification of soil carbon monitoring priorities.
Complementary approaches, different climate assumptions
The Boeotia and Sardinia examples use repeated historical climate over 30 and 40 simulated years, respectively. The Lower Seyhan Plain application establishes a 2022 baseline and projects SOC from 2023 to 2100 under SSP5-8.5. These outputs should therefore be interpreted within their respective climate, time-horizon and management assumptions, rather than as directly equivalent simulations.
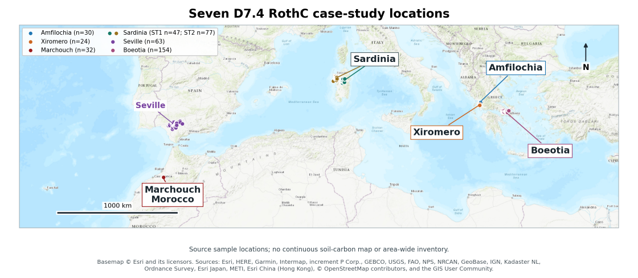
Figure 1. Study areas contributing soil datasets to the SOILS4MED carbon modelling work in Greece, Italy, Spain and Morocco. Points include records outside the primary scenario analyses. The Lower Seyhan Plain application in Türkiye is presented separately below and is not shown on this map.
Basemap: Esri World Topographic Map. Sources: Esri, HERE, Garmin, Intermap, increment P Corp., GEBCO, USGS, FAO, NPS, NRCAN, GeoBase, IGN, Kadaster NL, Ordnance Survey, Esri Japan, METI, Esri China (Hong Kong), OpenStreetMap contributors and the GIS User Community. © Esri and its licensors.
1. Management scenarios under historical climate
Georeferenced scenario results show differences among sampled locations and provide a basis for discussing carbon management options and planning field monitoring. The Boeotia and Sardinia examples below are simulations under repeated historical climate, not measured changes in SOC.
Boeotia: crop residues and soil cover
In Boeotia, the middle-input grass-cover scenario for permanent crops produced an average SOC gain of 10.0 tonnes of carbon per hectare (t C ha⁻¹) over 30 years. The bare-soil scenario produced an average loss of 16.1 t C ha⁻¹ across the same 82 sites. These scenarios change both carbon inputs and soil cover.
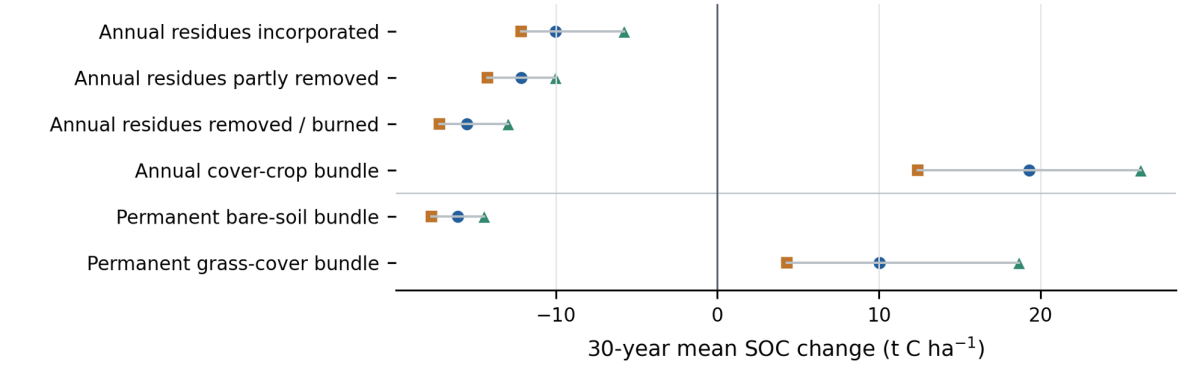
Figure 2. Simulated 30-year changes in soil organic carbon in Boeotia. Squares, circles and triangles show lower, middle and upper carbon-input levels. The upper four rows represent 49 annual-crop sites. The lower two rows represent 82 permanent-crop sites. Lines connect scenarios, not confidence intervals.
Sardinia ST2: grazing and assumed carbon inputs
Across 41 grazing sites in Sardinia’s second study area (ST2), an assumed annual soil carbon input of 4.5 t C ha⁻¹ yr⁻¹ increased mean topsoil SOC from 50.7 to 67.0 t C ha⁻¹ over 40 simulated years, a mean gain of 16.3 t C ha⁻¹. Annual inputs of 3.0 and 6.0 t C ha⁻¹ yr⁻¹ produced mean gains of 4.0 and 28.6 t C ha⁻¹, respectively (Figure 3).
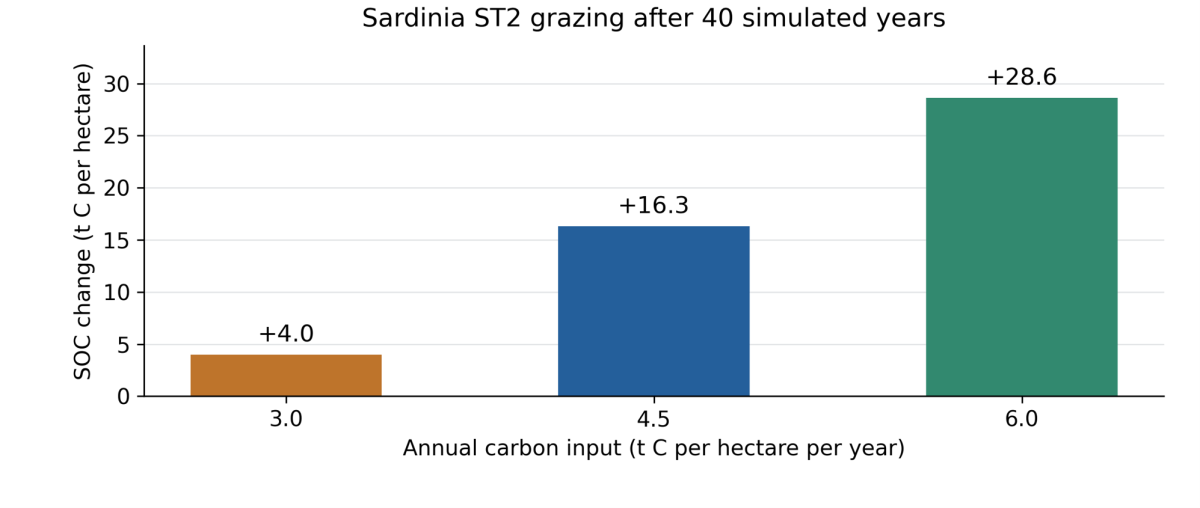
Figure 3. Simulated 40-year soil carbon changes across the same 41 grazing sites in Sardinia ST2. Bars show three assumed annual carbon-input rates, distributed equally across months. The model repeats the 1981–2000 historical climate twice.
2. High-resolution modelling in the Lower Seyhan Plain
Building on the same focus on soil carbon and management, the Lower Seyhan Plain application uses the Rothamsted Carbon Model (RothC) on a point-based grid with an approximate resolution of 100 metres (around 209,000 points). The model simulates SOC in the 0–30 cm topsoil layer at monthly intervals, generating high-resolution maps for the DSS. High-resolution spatial dataset as an input to the RothC model were prepared to represent soil, vegetation, climate and land use (Figure 4).
RothC model structure: RothC represents SOC in five pools with different turnover characteristics: decomposable plant material (DPM), resistant plant material (RPM), microbial biomass (BIO), humified organic matter (HUM) and inert organic matter (IOM). The modelling approach consists of three interconnected stages (Figure 4):
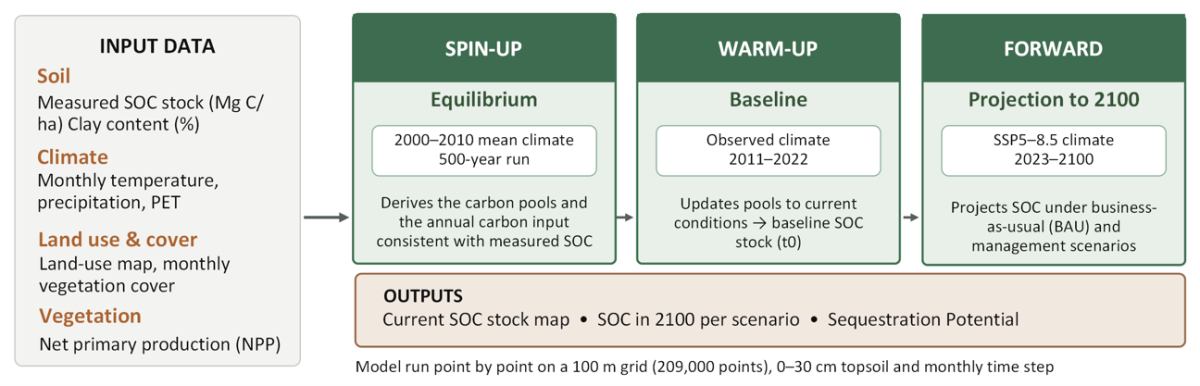
Figure 4. RothC modelling workflow for the Lower Seyhan Plain (Adana, Türkiye).
Results: The outputs describe baseline SOC stocks in 2022, projected stocks in 2100 under BAU scenario considering SSP5-8.5 and changes between 2022 and 2100 (Figure 5). All Lower Seyhan Plain stock maps refer to the 0–30 cm topsoil layer and express SOC stocks in t C ha⁻¹.
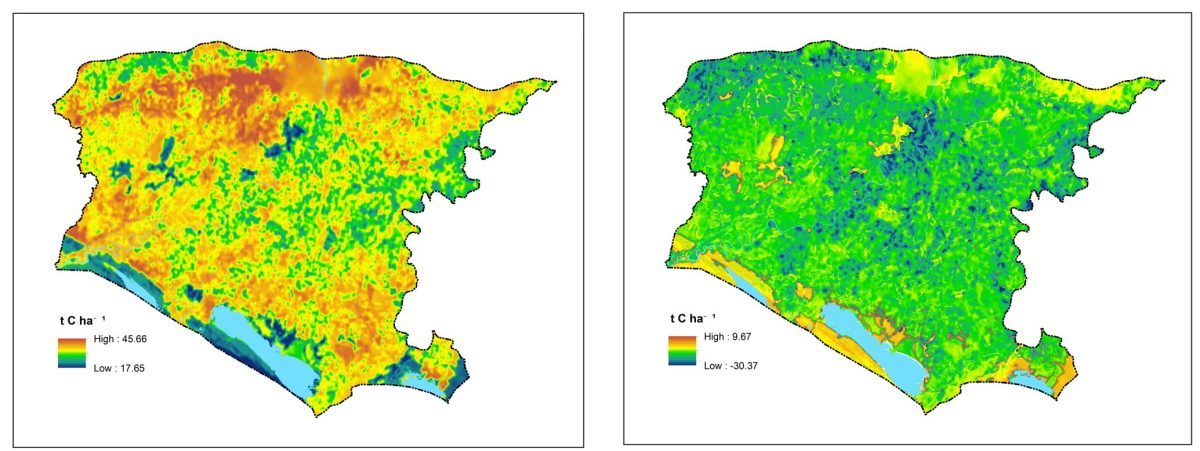
Figure 5. BAU modelling result of RothC for 2100 under SSP5-8.5 (a); Change in SOC stocks (ΔSOC, t C ha⁻¹) between 2022 and 2100. Negative values indicate carbon loss.
3. Connecting scenarios, maps and decision support
Together, the location-based analyses and the Lower Seyhan Plain maps provide complementary ways to explore soil carbon management. The Boeotia and Sardinia results compare defined changes in carbon inputs, crop residues, soil cover and grazing assumptions under repeated historical climate. The Lower Seyhan Plain application adds high-resolution spatial projections of current and future SOC stocks and carbon sequestration potential under specified climate and management scenarios.
Farmers, advisors and policymakers can use these outputs to compare management options, identify locations for carbon-friendly practices and prioritise soil carbon monitoring. The mapped outputs also support climate and Land Degradation Neutrality (LDN) reporting. The historical-climate results are simulations rather than measured changes, while the Lower Seyhan Plain results are projections conditional on SSP5-8.5 and the stated carbon-input assumptions.
For more, check out the following resources:
- Land degradation mapping and pesticide fate modelling through the LANDSUPPORT DSS Platform https://app.landsupport.eu/
- Soil health indicators mapping
- Land Use Planning for Land Degradation Neutrality through the new LUP4LDN tool https://soilgislab.crs4.it/lup4ldn/login